Ask an astronomer what the gas between the stars looks like and you will get the same answer it has given for half a century: there are two stable states. Cold and dense at around 100 kelvin, where gas collapses into clouds and eventually into stars. Warm and diffuse at roughly 8,000 kelvin, kept there by ultraviolet radiation from nearby stars. In between, the textbook logic goes, nothing lingers — the transition happens almost instantly.
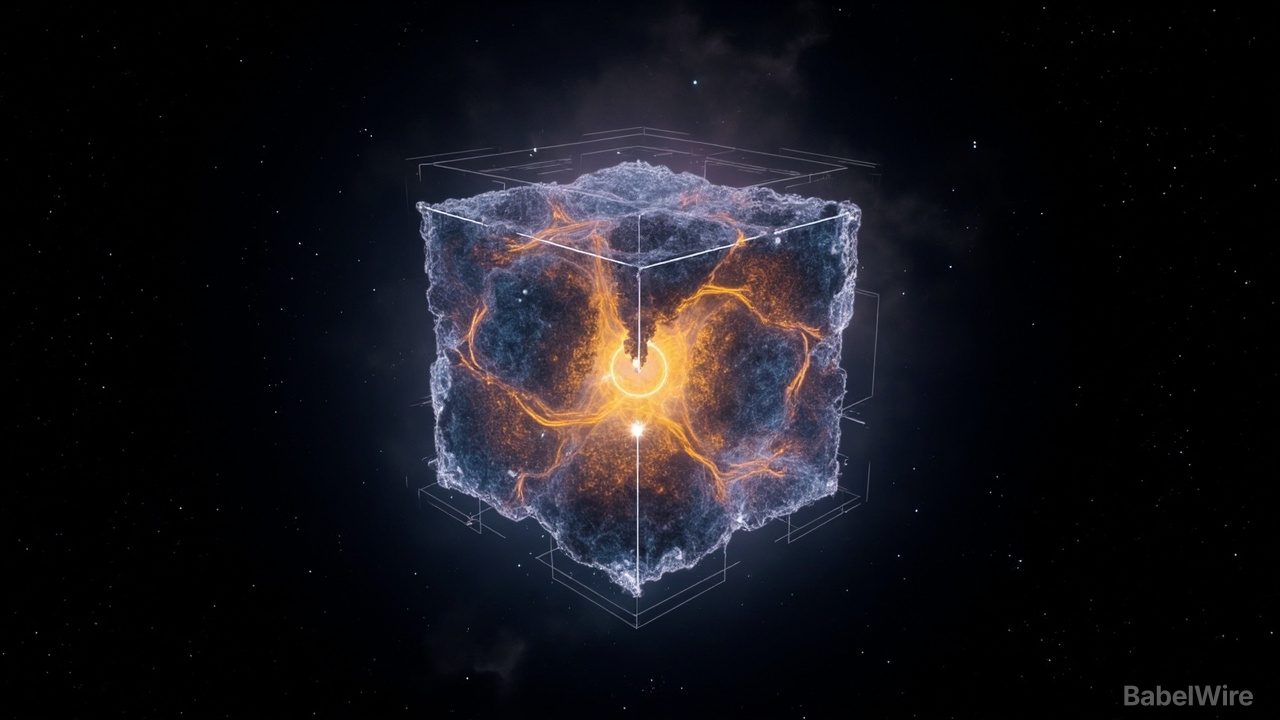
That answer is now under pressure, and not from a new telescope. It comes from a map. A team at the Technion in Haifa combined the density of dust with the intensity of ultraviolet radiation across a cube of the sun's neighbourhood, and produced the first three-dimensional temperature picture of the interstellar medium.
The ingredients came from two very different places. The dust map was built from the parallax measurements of the Gaia mission, which observed almost two billion stars between 2013 and 2025, and from the way their light reddens and dims on the way to us; in 2024 a separate team turned that into a continuous map of dust density inside a sphere more than 4,000 light-years across. What was missing was the other half of the physics: how hard that material is being heated from outside.
Jonathan Shelest, then a student working with Shmuel Bialy, found it almost by accident. Bialy had met the Stanford astrophysicist Troy Porter at a conference; Porter had produced a suitable ultraviolet map but had not yet published it. Shelest merged roughly 200 gigabytes of the two data sets, comparing dust density with radiation intensity at every point in space.
The result was far enough from expectation that he suspected his own code. In our galactic neighbourhood, 27% of the interstellar medium is cold, 32% is warm — and 41% sits squarely in the zone the theory called uninhabitable. "I thought I was wrong," Shelest said. "How do you go to your science adviser and tell him that you get so much unstable media?"
The fraction is not the whole story; the shape matters more. The unstable gas is not noise or a numerical artefact. It forms large, coherent blankets that wrap completely around the cold clouds, as though something keeps the material pinned in the intermediate state instead of letting it fall into one of the two equilibria.
Which is exactly where models have failed to match observation for decades. Galaxies are remarkably bad at turning gas and dust into stars; only a small fraction of the available material is ever consumed. The new map suggests a reason: the constant cycle of heating and cooling, driven by radiation and by feedback from young stars, keeps the gas stirred up and stops it collapsing quietly. Star formation is not throttled by a static equilibrium but by permanent unrest.
The authors are appropriately careful — the analysis is still in peer review. The objections are substantive too. Chris McKee, co-author of the three-phase model from 1977, notes that cold and warm regions may be packed too closely for the resolution to separate them. Philipp Frank of the Kavli Institute points at the method: an ensemble-averaged mean naturally smooths sharp contrasts, so an abrupt boundary between cold and warm would be softened into a gentle gradient, inflating the unstable fraction. The authors counter with a test on a second, coarser dust map, where the unstable share moved by only about 5%.
Whatever survives peer review, the direction is not in doubt. The map turns a convenience into a measurement problem. The space between the stars is not the quiet backdrop against which everything else happens. It is part of what happens — and star formation depends on it.